Why
DayWell
Because your health data shouldn't feel like a spreadsheet.
End-to-end design: UX, UI, responsive layouts and theming for late-night check-ins.
Two people checking in at 11pm
Both already track their days. Neither gets an answer out of the data they collect.
“I open three apps before bed and still don’t know if today was good.”
“I have years of charts and no idea what to change.”
Health tracking is fragmented and rarely actionable.
Data scattered across single-purpose apps, served as dense charts that never become daily habits.
A dashboard that turns numbers into readable stories.
High-level metrics paired with human-friendly summaries, trends you understand at a glance.
Open the Figma file →Glance first, dive later
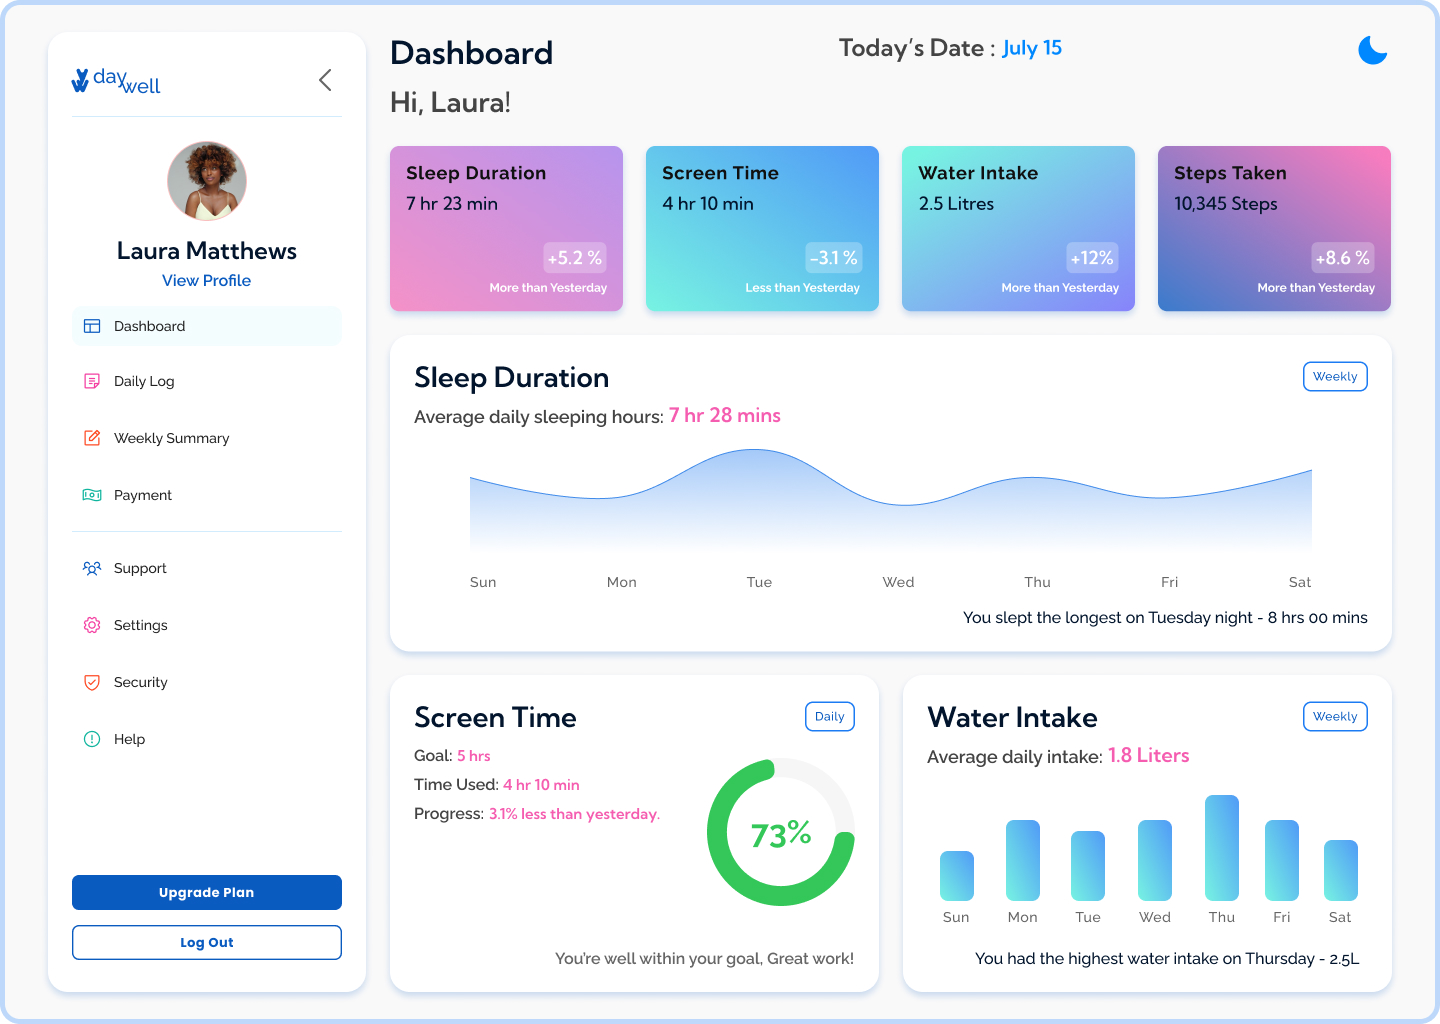
Color-coded metric cards up top; charts with plain-language takeaways below, “You slept the longest on Tuesday night.”
Three decisions did the heavy lifting
Interpretation made easy
Dense charts intimidate. Metric cards with simple pills (“+12% more than yesterday”) show progress before any math.
Charts that speak
A peak on a graph explains nothing. Every chart carries a written takeaway, so the data feels instantly useful.
Rethought, not resized
Mobile isn't a shrunken desktop. The IA restacks into a one-handed, scannable checklist with full-size touch targets.
Same data, different posture.
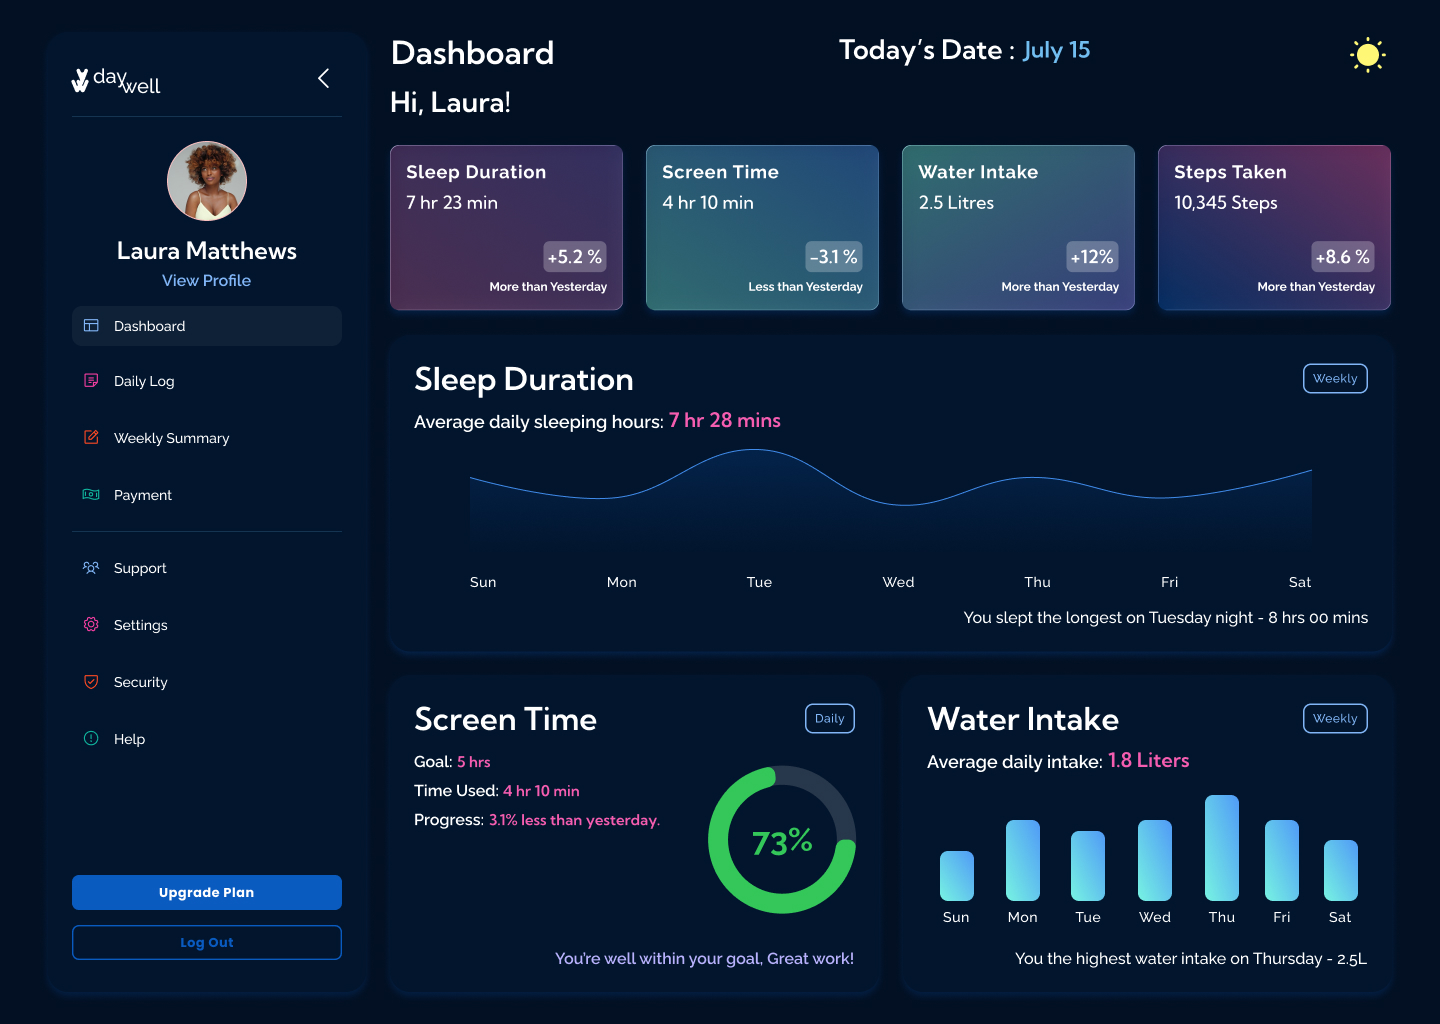
Analytical and expansive on a laptop; a vertical, thumb-friendly stack on the go. Dark mode keeps 2 a.m. check-ins comfortable.


The best dashboard shows less, the habits that matter get room to breathe.
Prioritization and hierarchy, not shrinking, kept mobile as valuable as desktop.
Toggleable metrics (heart rate, calories) with a layout that adapts to personal goals.
YOU